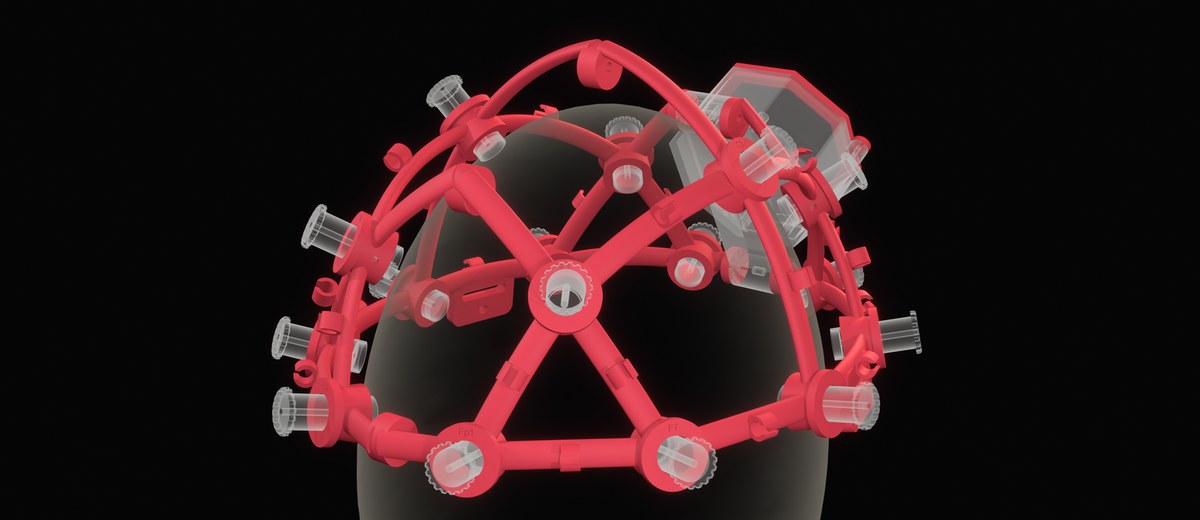
The Open EEG Viewer shows brain waves live in your browser. Connect a Muse headband by Bluetooth or an OpenBCI Cyton board by USB, or play an open EEG recording, and the page draws every channel, the spectrum, the power in each band and a map of the alpha rhythm over the head. It is free, it needs no install, and the signal stays on your device. It is the software part of the open EEG headset frame, so the frame, the board and the viewer make one open stack.
Twenty seconds with the eyes open, then twenty with the eyes closed. A tone marks each change.
| Device | Connection | Browser | Channels |
|---|---|---|---|
| Muse 2 or the first Muse S | Bluetooth, from the page | Chrome or Edge on a computer, Chrome on Android | 4, at AF7, AF8, TP9 and TP10, 256 Hz |
| OpenBCI Cyton | USB dongle, from the page | Chrome or Edge on a computer | 8, at 250 Hz |
| OpenBCI Cyton with Daisy, in the open headset frame | USB dongle, from the page | Chrome or Edge on a computer | 16, at 125 Hz each |
| No device | Demo, open recording | Any browser, phones included | 16, at 160 Hz |
For a Muse, turn the headband on, press Muse and choose it in the list the browser shows. For a Cyton, put the dongle in a USB port with its switch on GPIO 6, turn the board on to PC, press Cyton and choose the serial port of the dongle. The page asks the board for its settings, finds the Daisy if it is there, and starts the stream.
On the frame, connect the electrodes to the inputs in this order, so that the viewer names each channel correctly.
| Input | 1 | 2 | 3 | 4 | 5 | 6 | 7 | 8 |
|---|---|---|---|---|---|---|---|---|
| Cyton | Fp1 | Fp2 | C3 | C4 | P7 | P8 | O1 | O2 |
| Daisy (9 to 16) | F7 | F8 | F3 | F4 | T7 | T8 | P3 | P4 |
The first eight cover the front, the centre, the sides and the back of the head, so a Cyton without the Daisy still gives a useful map, and it still has O1 and O2 for the alpha rhythm. The ear clips go to SRB and bias, as in the build guide.
Each row is one electrode, filtered from 1 to 45 Hz with a notch at the mains frequency, 50 Hz in Europe and most of the world, 60 Hz in the Americas. The square beside each name shows the contact. Green is a normal signal, gold is a signal above 100 microvolts, often movement or a loose electrode, and red is a flat line or an input at the end of its range, often no contact at all.
The red channels are the ones at the back of the head, O1 and O2, or TP9 and TP10 on a Muse. The spectrum and the band power come from them. Alpha share is the power from 8 to 13 Hz divided by the power from 1 to 40 Hz, averaged over the last 4 seconds. The head map shows the same share for every electrode, so you can see where the alpha is strongest.
Close your eyes and the alpha rhythm, near 10 Hz, grows over the back of the head. Hans Berger reported it in 1929 in the first paper on the human EEG, and it is still the first check of any EEG setup, because it needs no task and shows within seconds that the electrodes see the brain. The test on this page runs 20 seconds with the eyes open and 20 with the eyes closed, and compares the alpha share of the two halves. In the demo recording the alpha share at O1 and O2 is about 15 percent with the eyes open and about 65 percent with the eyes closed, measured over each full minute with the method of this page.
On a Muse the effect is smaller, because the headband has no electrodes over the back of the head. TP9 and TP10 behind the ears still pick up part of the alpha rhythm.
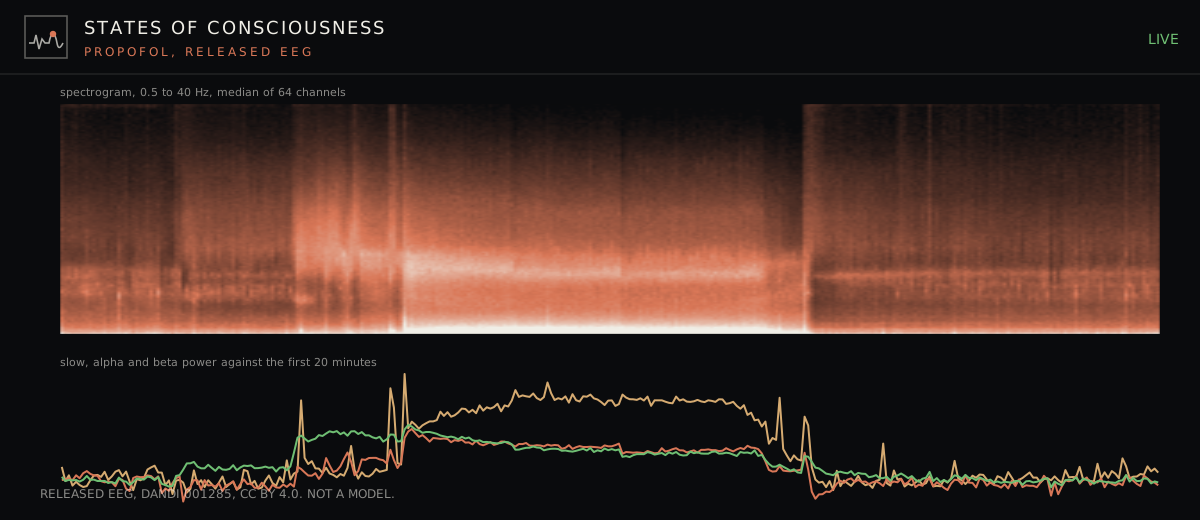
The same bands that this viewer measures change when consciousness changes. Alpha over the back of the head is strongest in quiet waking with the eyes closed. Under propofol anaesthesia the alpha moves to the front of the head and slow waves below 1 Hz grow, and both reverse when consciousness returns. The States of Consciousness console plays 154 minutes of open EEG through that change. The viewer lets anyone record the waking baseline of the same rhythms on their own head, and the guide to the 10-20 system explains which electrode sees which part of the cortex. The wider questions of what a measurement of the brain can tell about consciousness are in the overview of how scientists race to define AI consciousness.
The signal goes from the device into this page and nowhere else. The page sends no EEG to a server, and a recording is a file that you save. The demo recording is the only data the page loads.
This viewer is for learning and home experiments. It is not a medical device and it does not diagnose anything. The Muse connection follows the protocol as the open muse-js library implements it, and the Cyton connection follows the data format that OpenBCI publishes. The decoders of this page give the same values as the test data of muse-js and of the official OpenBCI library, including a packet recorded from a real Cyton, and the test is in the source folder. This project has not yet run the page with each device. Newer Muse models, such as the Muse S Athena, may use another protocol. The Ganglion uses a compressed format that this page does not read yet. For it, and for any board, the OpenBCI GUI desktop program and the BrainFlow library, both MIT, are the reference tools.
The viewer is one JavaScript file with no dependencies, under the MIT licence. The code is in the open hardware repository next to the frame it was made for, so anyone can run it, change it or build on it.